Best Analytics Tools for Startups 2026 Guide
Discover top analytics platforms for startups in 2026. Compare product analytics, web analytics tools & find the best solution for your business needs.
Marco Delvane
Growth Team
Key Takeaways
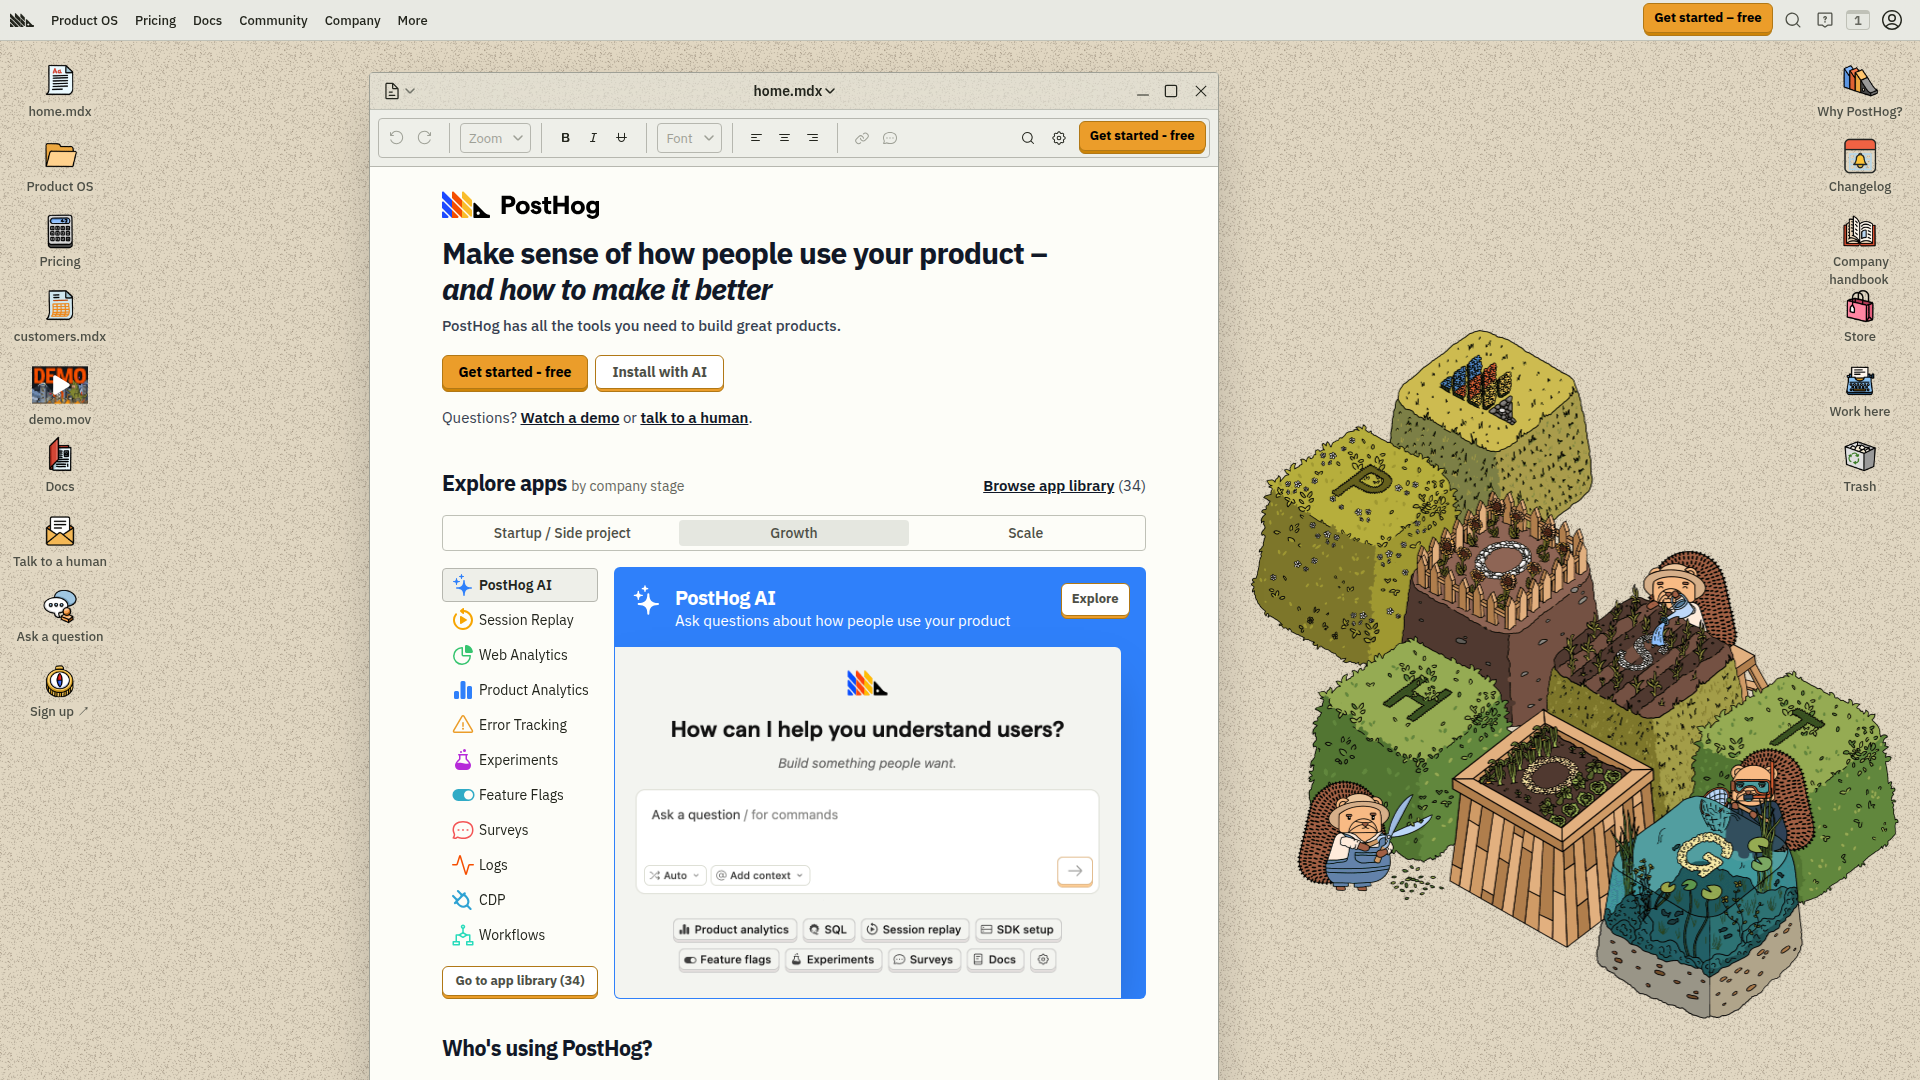
- Best overall: PostHog combines product analytics, session replay, and feature flags in one platform ($0-450/mo)
- Privacy-first web analytics: Plausible Analytics and Umami offer GDPR-compliant tracking without cookies
- Enterprise product analytics: Mixpanel and Amplitude lead for scale and advanced cohort analysis
- Budget pick: Usermaven starts at $0 with generous free tier for early-stage startups
- Open-source option: Umami and GoatCounter for self-hosted, privacy-focused tracking
Why Startup Analytics Matter in 2026
Every startup faces the same brutal reality: 90% fail within three years. The survivors share one trait—they obsess over data. Not vanity metrics like page views, but behavioral signals that predict churn, reveal product-market fit, and expose friction in user journeys.
The analytics landscape shifted dramatically in 2024-2025. Google Analytics 4 confused everyone with its convoluted interface. Privacy regulations tightened. Cookieless tracking became standard. AI-powered insights replaced manual dashboard staring.
Modern startups need tools that answer three questions: Who are my users? (tracking), What are they doing? (behavior), and Why are they leaving? (conversion optimization). The right analytics stack costs under $200/month and delivers insights worth 100x that.
Quick Comparison: Top Analytics Tools for Startups
| Tool | Price | Best For | Free Tier? | VGS Verdict |
|---|---|---|---|---|
| PostHog | $0-450/mo | All-in-one product analytics | Yes (1M events) | Most complete platform for PLG startups |
| Plausible Analytics | $9-150/mo | Privacy-first web analytics | 30-day trial | GA4 replacement without complexity |
| Mixpanel | $0-899/mo | Product analytics at scale | Yes (20M events) | Industry standard for SaaS products |
| Umami | $0-20/mo | Open-source web analytics | Yes (free self-hosted) | Best privacy-focused free option |
| Usermaven | $0-199/mo | Marketing + product analytics | Yes (unlimited) | Hidden gem for early-stage startups |
| Amplitude | $0-custom | Enterprise product analytics | Yes (10M actions) | Power tool for data-driven teams |
| Hotjar | $0-213/mo | Heatmaps + session replay | Yes (35 sessions/day) | Essential UX optimization companion |
| Microsoft Clarity | Free | Free heatmaps + recordings | Yes (unlimited) | Zero-cost session replay alternative |
Product Analytics: Understanding User Behavior
Product analytics tools track what users actually do inside your product—clicks, feature adoption, conversion funnels, retention cohorts. This isn't about page views. It's about understanding which features drive value and which cause churn.
The category leaders—PostHog, Mixpanel, and Amplitude—all offer event-based tracking, funnel analysis, and cohort retention. The difference? PostHog bundles session replay and feature flags. Mixpanel excels at user segmentation. Amplitude handles enterprise-scale data (billions of events monthly).
Usermaven entered as the budget-friendly alternative, combining product analytics with marketing attribution. Their unlimited free tier makes them ideal for pre-PMF startups still experimenting.
Web Analytics: Privacy-First Tracking
Traditional web analytics (Google Analytics) relied on third-party cookies. EU regulations, browser privacy updates, and user awareness killed that model. Modern web analytics tools use first-party data, respect privacy, and skip cookie consent banners entirely.
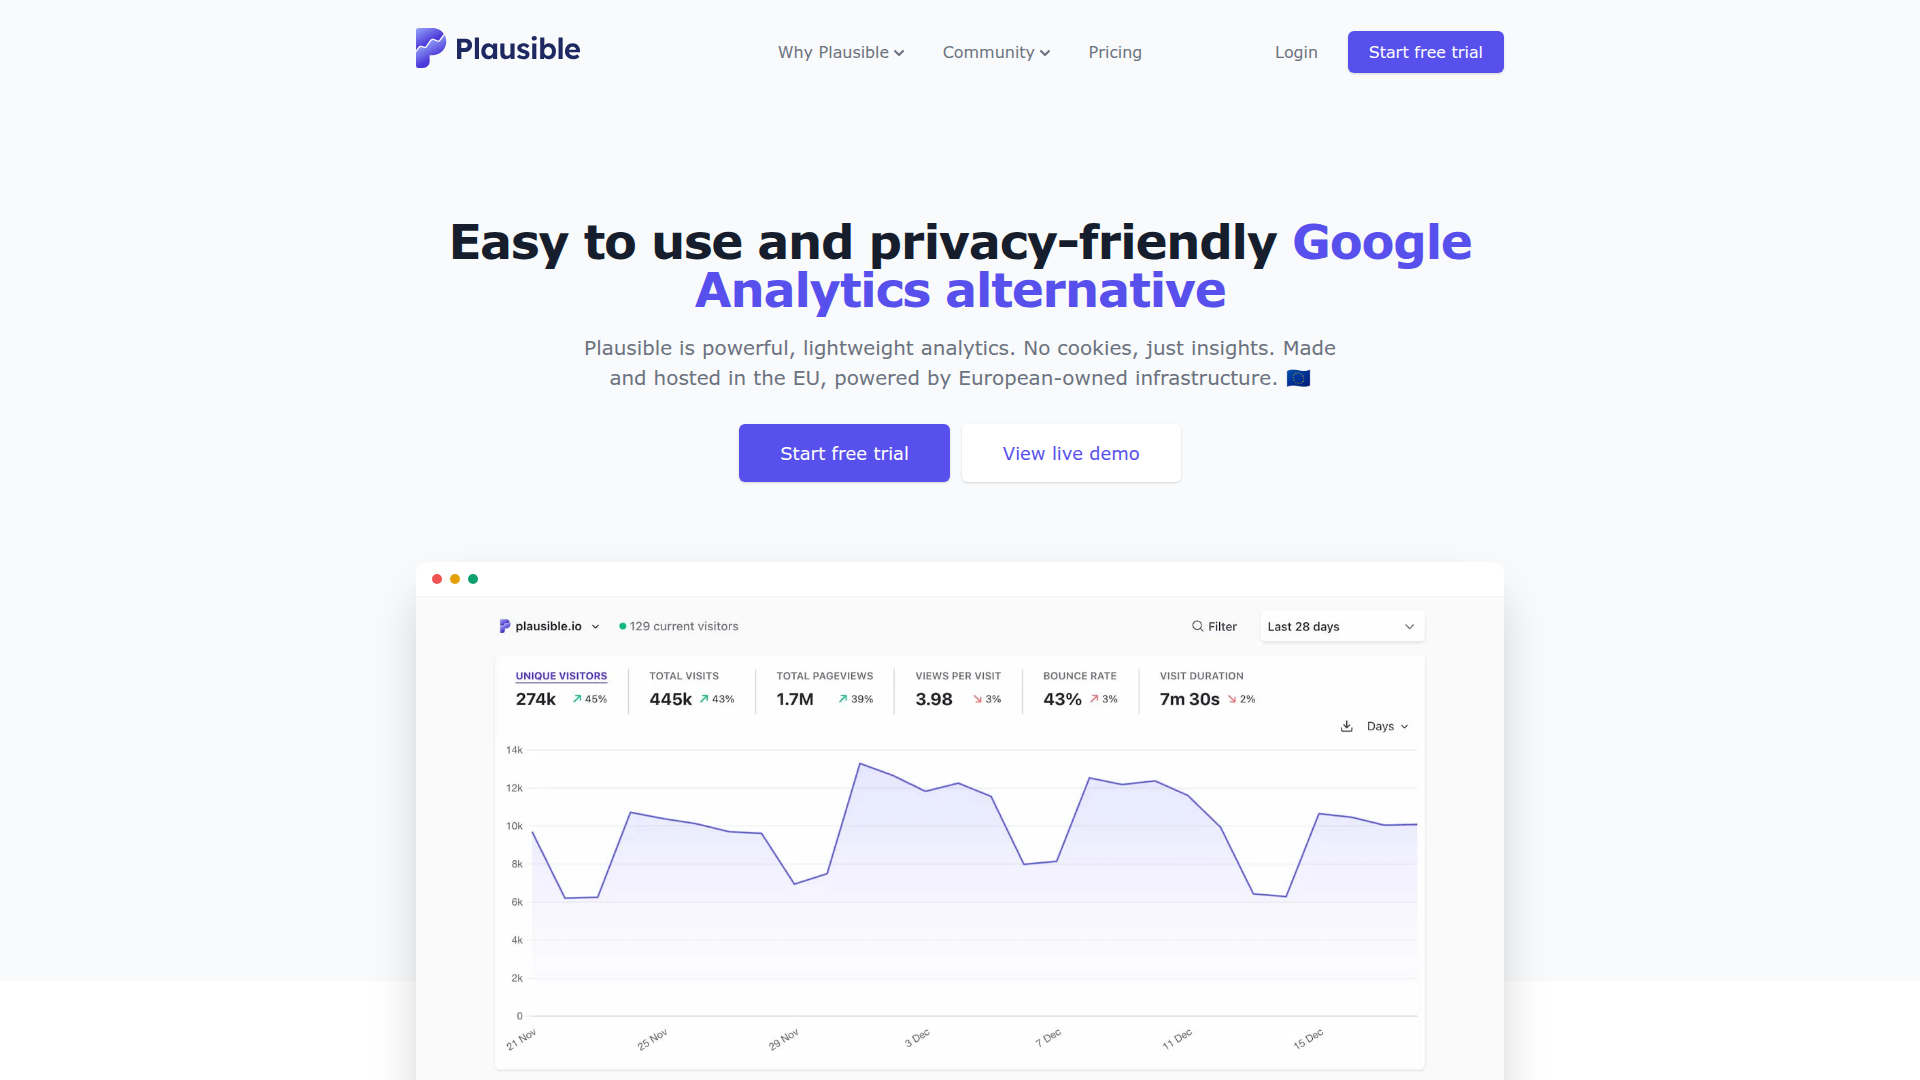
Plausible Analytics leads the privacy-first movement. Their script weighs under 1KB (Google Analytics is 45KB+), loads faster, and displays all metrics on one screen. No training required. No overwhelming reports. Just traffic sources, page views, bounce rates, and goals.
Umami offers similar simplicity as open-source software. Self-host for free or use their cloud at $20/month. GoatCounter takes minimalism further—text-based interface, sub-second load times, zero JavaScript bloat.
Session Replay & Heatmaps: See What Users See
Numbers tell you what happened. Session replays show you why. Watching actual users navigate (or struggle with) your product reveals friction that event data misses—rage clicks, dead ends, confusing UI elements.
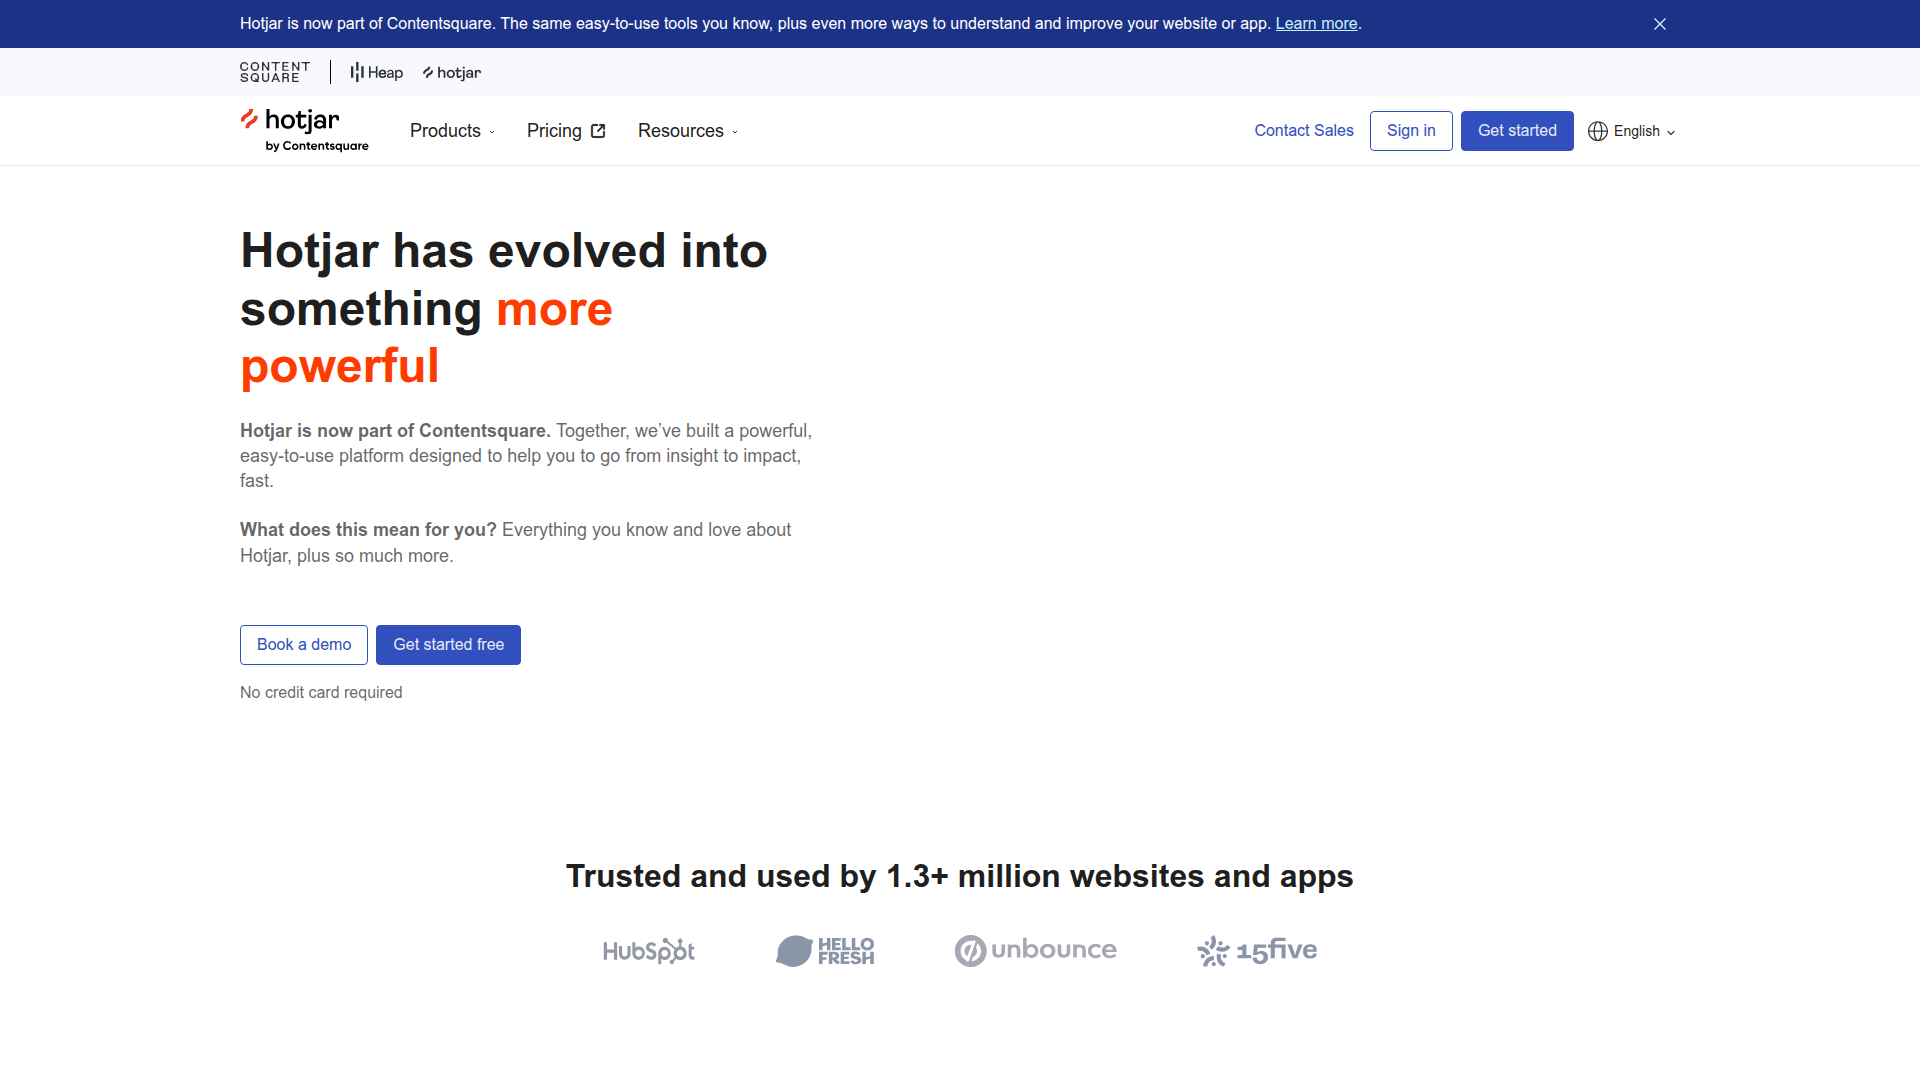
Hotjar pioneered this category and remains the standard. Their heatmaps overlay click density, scroll depth, and mouse movement patterns. Session recordings show user journeys frame-by-frame. Feedback widgets collect qualitative insights directly from users.
Microsoft Clarity disrupted the market by offering unlimited session recordings and heatmaps—completely free. No credit card. No limits. The catch? It's Microsoft, so expect enterprise-level data handling and potential overkill for small startups.
PostHog bundles session replay with product analytics, eliminating the need for separate tools. Their approach: identify drop-off points in funnels, then watch recordings of users who abandoned to understand why.
Marketing Analytics: Attribution & Conversion Tracking
Marketing analytics bridges the gap between ad spend and revenue. Which channels drive qualified leads? Which campaigns convert? What's the actual ROI of that LinkedIn ad campaign?
Usermaven combines marketing attribution with product analytics, showing the full customer journey from first touch to activation. Most product analytics tools (Mixpanel, Amplitude, PostHog) handle basic marketing attribution through UTM parameters and custom event properties.
For startups under $1M ARR, built-in attribution within your product analytics tool suffices. Past that threshold, consider specialized tools as you scale ad spend and optimize CAC payback periods.
Open-Source Analytics: Self-Hosted Freedom
Open-source analytics tools offer three advantages: full data ownership, unlimited customization, and zero recurring costs (besides hosting). The tradeoff? Technical setup and maintenance overhead.
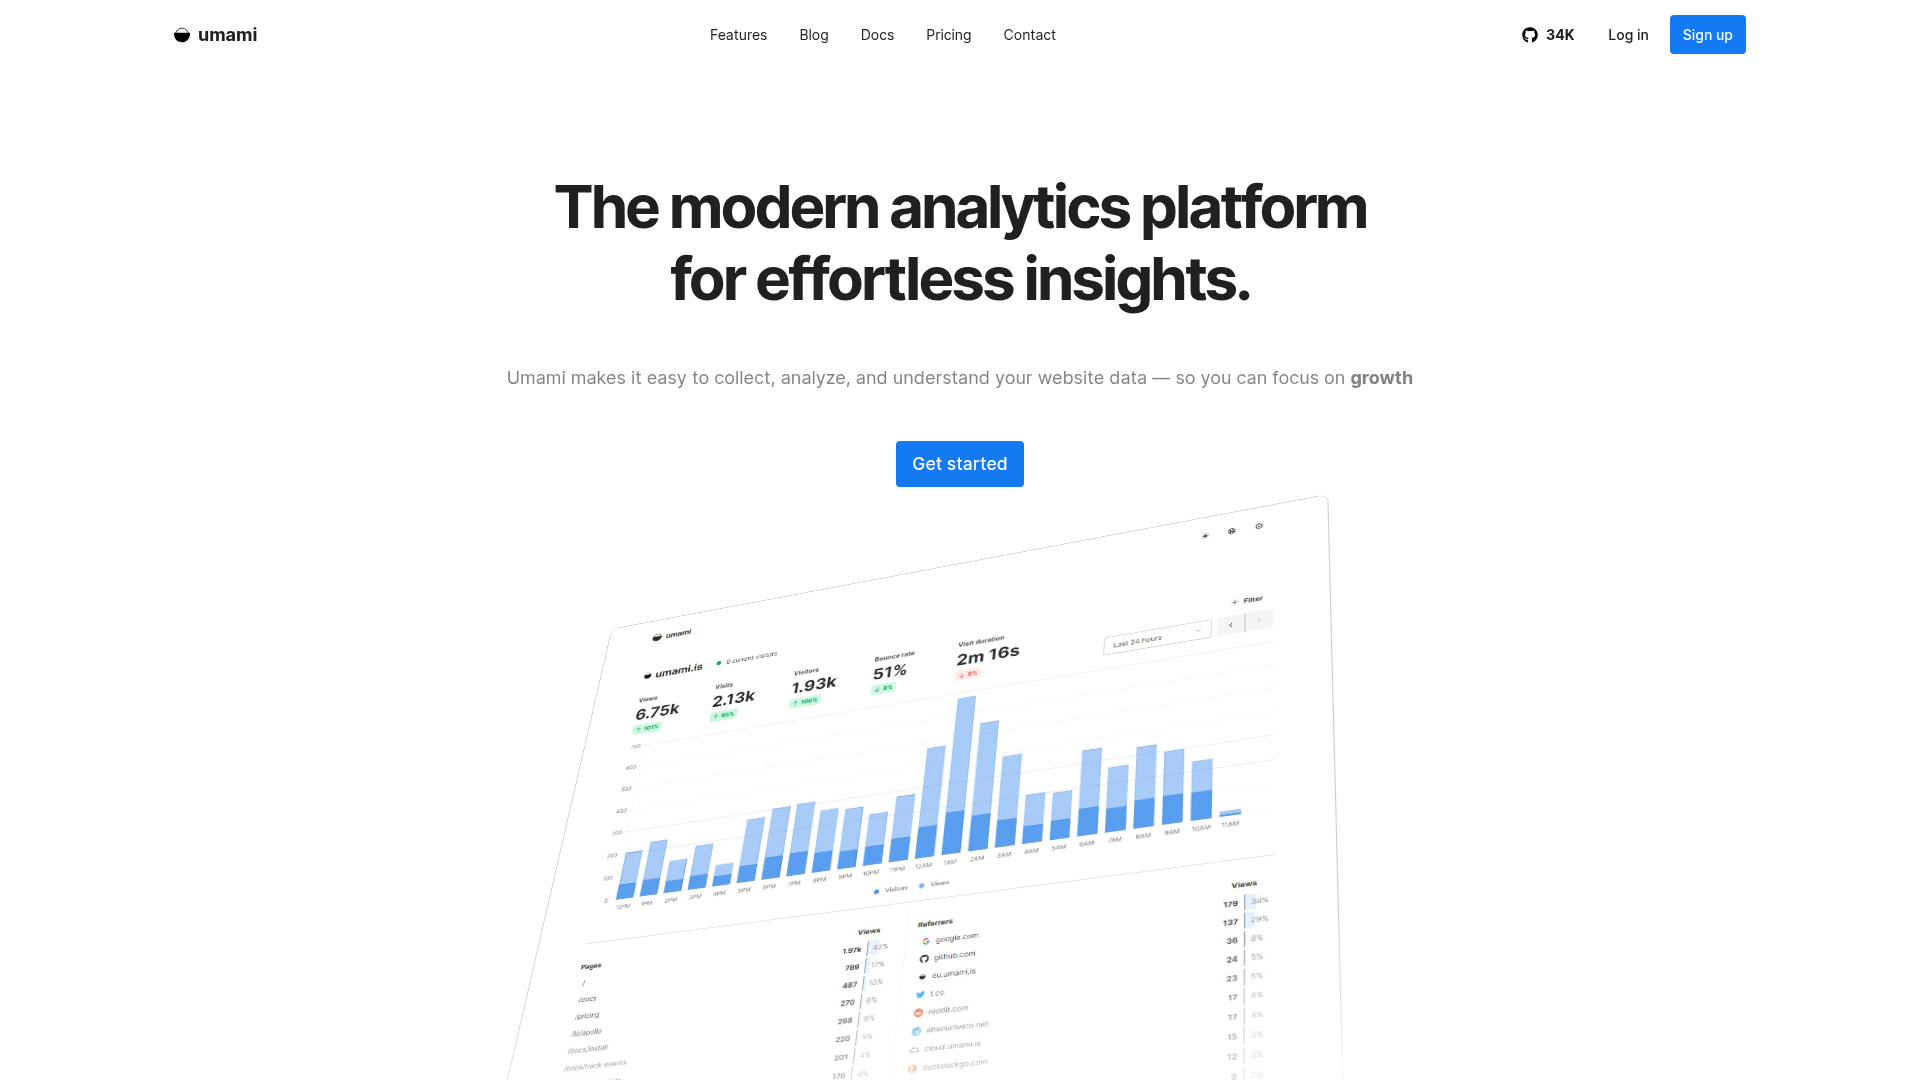
Umami leads for web analytics. Deploy on Vercel in under 10 minutes. Track unlimited websites. Export data to Postgres or MySQL. The cloud version costs $20/month if self-hosting feels like overkill.
PostHog offers self-hosted product analytics. Their open-source version includes event tracking, funnels, and cohorts. The cloud version adds session replay, feature flags, and experimentation without infrastructure headaches.
GoatCounter takes minimalism to extremes—fast, lightweight, and deliberately simple. Perfect for content sites and blogs where Google Analytics creates more noise than signal.
AI-Powered Analytics: Insights Without Manual Analysis
AI analytics tools answer questions in plain English instead of forcing you to build custom reports. "Which feature drives highest retention?" "Why did signups drop last week?" "What do power users have in common?"
Amplitude integrated AI-driven insights that automatically surface anomalies, predict churn risk, and recommend experiments. PostHog uses AI to summarize session replays, flagging frustration signals like rage clicks and error patterns.
The promise: spend less time building dashboards, more time acting on insights. The reality: AI excels at pattern detection but still requires human interpretation for strategic decisions. Use AI as a discovery layer, not a replacement for analytical thinking.
How to Implement Analytics (Without Breaking Your Product)
The best analytics tool is worthless if implemented poorly. Follow this sequence:
Step 1: Define your north star metric. Revenue? Active users? Completed onboarding? Pick one metric that signals product-market fit.
Step 2: Map critical user actions. Identify 5-10 events that predict success: signup, activation milestones, core feature usage, upgrade triggers. Ignore vanity metrics like page views.
Step 3: Implement tracking incrementally. Start with authentication events (login, signup), then add feature adoption, finally layer conversion funnels. Testing in production beats perfect implementation delayed by months.
Step 4: Validate data accuracy. Send test events. Verify counts match reality. Check for missing events or duplicate tracking. Data quality matters more than data quantity.
Step 5: Build actionable dashboards. Create 2-3 views: weekly active users, retention cohorts, and conversion funnels. Ignore everything else until these stabilize.
Most startups over-instrument initially, tracking hundreds of events nobody analyzes. Better approach: start minimal, add events when specific questions arise that existing data can't answer.
How to Choose the Right Analytics Stack
Your analytics stack depends on your stage, technical resources, and primary use case. Here's the decision framework:
- Choose PostHog if you need product analytics + session replay + feature flags in one platform and have technical resources to implement event tracking
- Choose Plausible Analytics if you want simple, privacy-first web analytics without cookie banners and prefer lightweight tracking over complex behavioral analysis
- Choose Mixpanel if you're optimizing conversion funnels, need advanced cohort analysis, and want the industry-standard product analytics platform
- Choose Usermaven if you're pre-revenue, need both marketing attribution and product analytics, and want a generous free tier while validating PMF
- Choose Umami if you prefer open-source, want full data ownership through self-hosting, and value privacy compliance over advanced features
- Choose Hotjar if your primary goal is UX optimization through heatmaps and session recordings rather than event-based behavioral analysis
- Choose Microsoft Clarity if you need free, unlimited session replay and heatmaps without budget for paid tools
- Choose Amplitude if you're scaling past Series A, need enterprise-grade analytics, and require predictive insights and data warehouse integration
Analytics Tool Pricing Guide for Startups
Analytics costs scale with usage—events tracked, data retained, or features unlocked. Here's realistic pricing at different startup stages:
Pre-revenue ($0-10K MRR): Stay under $50/month total. Use free tiers aggressively. Usermaven (free unlimited), Microsoft Clarity (free unlimited), Umami self-hosted ($0) or Plausible Analytics ($9/month).
Early traction ($10K-100K MRR): Budget $100-300/month. PostHog ($0-150/month), Mixpanel free tier, Hotjar Basic ($32/month), Plausible Analytics ($19-29/month).
Growth stage ($100K-1M MRR): Expect $500-2,000/month. PostHog Scale ($450/month), Mixpanel Growth ($25-100/month based on MTUs), Amplitude Growth tier, Hotjar Plus ($80-171/month).
Scale stage ($1M+ MRR): Budget $3,000-10,000/month. Enterprise tiers of Amplitude, Mixpanel, or PostHog with custom contracts based on event volume and data retention needs.
Pro tip: Negotiate annual contracts at Series A+. Most vendors offer 20-30% discounts for yearly commitments. Lock in lower rates before your usage explodes.
Essential Analytics Integrations
Analytics tools work best when connected to your broader stack. Critical integrations:
Data warehouses: Send event data to Snowflake, BigQuery, or Redshift for custom analysis. Mixpanel, Amplitude, and PostHog all support warehouse exports.
CRMs: Sync user behavior to Salesforce, HubSpot, or Attio for sales context. "This lead viewed pricing 5 times this week" changes conversations. Usermaven and product analytics platforms handle this natively.
Feature flags: PostHog bundles feature flags with analytics, enabling A/B tests directly within the platform. Otherwise integrate LaunchDarkly, Statsig, or GrowthBook for experimentation.
Support tools: Connect analytics to Intercom, Zendesk, or Front to view user behavior during support conversations. Understanding what a frustrated user tried before contacting support accelerates resolution.
7 Analytics Mistakes Every Startup Makes
Avoid these traps that waste time and money:
1. Tracking everything, analyzing nothing. 500 custom events generate zero insights if nobody reviews them. Start with 10 critical events, expand only when specific questions demand new data.
2. Ignoring data quality. Duplicate events, missed tracking, bot traffic—garbage data leads to garbage decisions. Validate tracking weekly in early stages, monthly after stabilization.
3. Obsessing over vanity metrics. Page views, total signups, and social media followers feel good but don't predict success. Focus on activation rates, retention cohorts, and revenue metrics.
4. Building dashboards nobody checks. If a metric doesn't trigger action, stop tracking it. Dashboards should answer "What do we do next?" not "Isn't this interesting?"
5. Over-indexing on free tiers. Free tools work until they don't. The $50/month you save by staying on free plans costs $5,000 in engineering time duct-taping limitations. Upgrade when you feel friction.
6. Neglecting privacy compliance. GDPR fines start at €20 million or 4% of revenue. Use privacy-first tools, implement proper consent, and document data handling. Non-compliance isn't worth the risk.
7. Reinventing analytics from scratch. Building custom analytics feels empowering until you're maintaining infrastructure instead of shipping product. Use existing tools unless analytics IS your product.
FAQ
What's the difference between web analytics and product analytics?
Web analytics tracks website visitors, traffic sources, and page views (marketing focus). Product analytics tracks user behavior inside your application—feature usage, conversion funnels, retention cohorts (product focus).
Do I need multiple analytics tools?
Most startups run 2-3: web analytics (Plausible), product analytics (PostHog/Mixpanel), and session replay (Hotjar/Clarity). All-in-one tools like PostHog can consolidate into one platform.
How much do analytics tools typically cost for startups?
Expect $0-50/month pre-revenue, $100-300/month at early traction ($10K-100K MRR), and $500-2,000/month in growth stage ($100K-1M MRR). Enterprise starts at $3K+/month.
What's better: self-hosted or cloud analytics?
Cloud analytics (SaaS) offers faster setup, automatic updates, and zero maintenance. Self-hosted provides data ownership, unlimited customization, and lower long-term costs but requires technical resources.
Are Google Analytics alternatives really necessary?
Yes. GA4's complexity, privacy concerns, and cookie requirements push startups toward simpler, privacy-first alternatives like Plausible, Umami, or PostHog that deliver better insights with less setup.
How long does it take to implement product analytics?
Basic implementation takes 1-2 days for web analytics, 1-2 weeks for product analytics with proper event tracking. Full maturity (clean dashboards, validated data, team adoption) requires 2-3 months.
Can free analytics tools scale with my startup?
Free tiers work until 100K-500K monthly events. Past that, expect to pay. PostHog, Mixpanel, and Amplitude offer generous free tiers that support early growth before requiring upgrades.
About the Author
Marco Delvane
Growth Team at Vibe Growth Stack. Tested 100+ growth tools so you don't have to. Writes about what actually works for startups — no fluff, no affiliate bias.
Related Articles
Get growth tips in your inbox
No-BS growth hacks, tool reviews, and best-value picks. Weekly.
Unsubscribe anytime. We hate spam too.